Topics and Learning Outcomes
| Topics | After reading this Unit and completing the assigned readings in Physical Geology and the associated exercises and questions, you should be able to: |
|---|---|
| 5-1 Shoreline processes |
|
| 5-2 Climate change |
|
| 5-3 Geological history of western Canada |
|
Reading
Read Chapters 17, 19 and 21 in Physical Geology.
5-1 Shoreline Processes
As described in the introduction to Chapter 17, we need to understand shoreline processes so that we can remain safe while visiting or living in coastal regions, and so that we can avoid making changes that could disturb coastal equilibrium.
Section 17.1 discusses wind waves, the key driver of coastal processes. Read carefully through the material on wave parameters, and the various factors that determine the size of waves. One of the important features of ocean waves is that they tend to get steeper as they get bigger, which is shown in Figure 5-1, although the amplitudes are somewhat exaggerated to make the differences in the ratios more obvious.
Enlarge
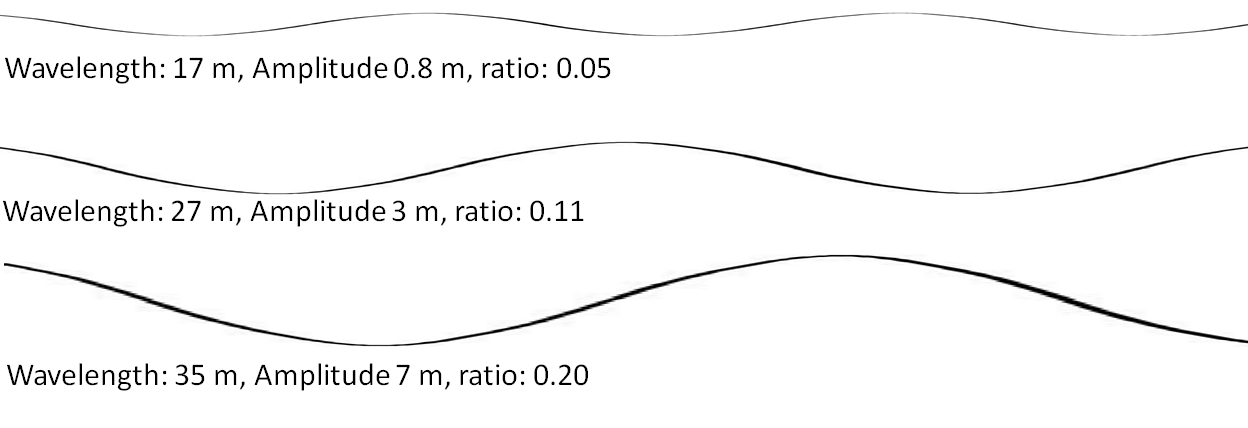
© Steven Earle. Used with permission.
Completing Exercise 17.1 will help with your understanding of the factors that are important for determining wave dimensions.
Figure 17.3 shows how the water beneath the surface moves in circular orbits as a wave passes over, and how this disturbance of the water column continues to a depth of one-half the wavelength.
Exercise: If you haven’t already viewed the animation of those orbits at http://en.wikipedia.org/wiki/Wind_wave#/media/File:Deep_water_wave.gif, please do so now. This animation will really help you to understand this concept.
Figure 17.4 shows how this disturbed water interacts with the lake or ocean bed as the wave approaches shallow water, and how this movement increases the height of the waves and produces breakers. Most waves approach the shore at an angle. Figure 17.6 and 17.7 illustrate how this leads to wave refraction—making the waves nearly parallel to the shore—which also generates a longshore current within the surf zone.
Exercise 17.2 is intended to help you to understand wave refraction and the generation of a longshore current.
A longshore current can move massive amounts of water along the shore and, in the process, can also push the sediment churned up by breaking waves. Sediment also is moved on the beach face itself by swash and backwash as waves wash up at an angle and then down vertically (Figure 17.8). Longshore currents, and swash and backwash are the two processes that combine to create longshore drift—the slow and steady movement of sediment along the shore in the direction of the prevailing approach of waves.
The relentless push of waves up the beach can result in an accumulation of water on the beach face, some of which returns to the ocean via rip currents, as illustrated on Figure 17.9 and 17.10.
Tides are important to shoreline erosional and depositional processes, mostly because they expand the range of elevations over which wave energy hits the shore, thus making ocean coastal features—such as beaches—wider than they would be otherwise.
Wave erosion has a tremendous impact on coastal features, especially on open-ocean coasts where the waves can be large and virtually constant. As shown on Figure 17.11, wave refraction results in the energy being focussed on headlands, and this ultimately leads to coastal straightening (Figure 17.15). Some of the important features of coastal erosion, such as stacks, arches, caves, cliffs and wave-cut platforms are described in Section 17.2 of the text.
Exercise: Identify some of the coastal erosion features in Figure 5-2.
Enlarge
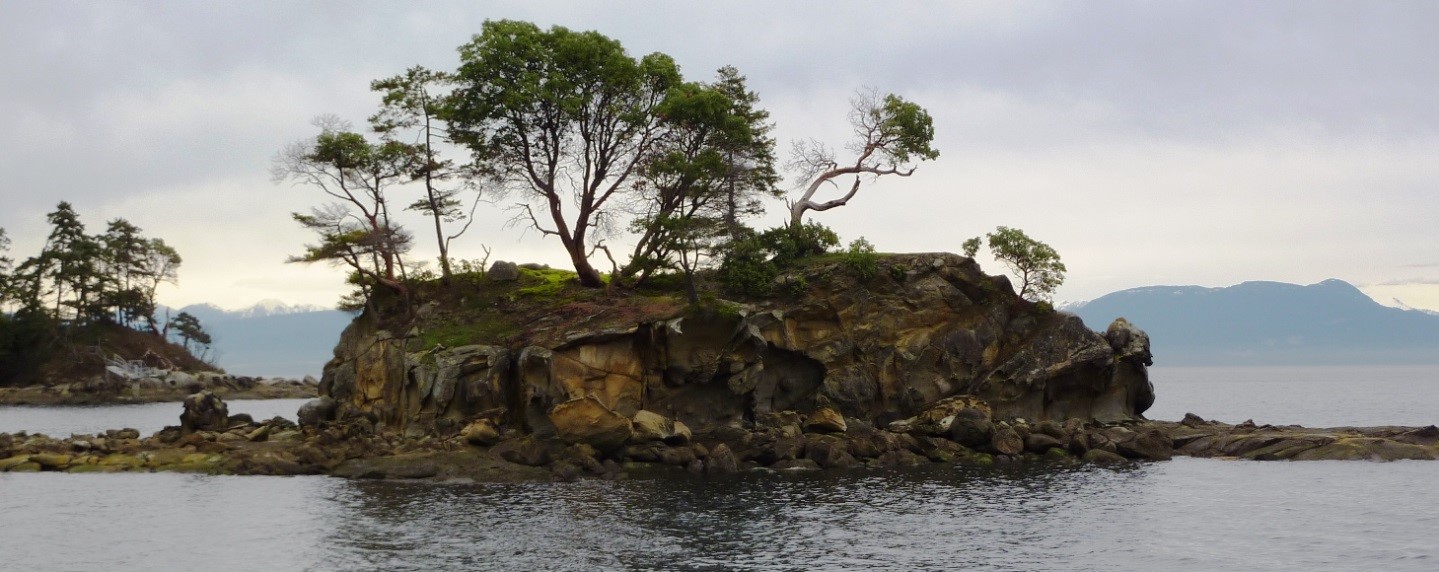
© Steven Earle. Used with permission.
Depositional processes also are very important along coasts, especially to people who like to hang out on beaches. Figure 17.16 summarizes the components of a sandy marine beach. A beach can be divided into a backshore (above the high-tide level) and a foreshore (between low and high tide) (see Figure 5-3). If the shoreline is relatively flat, the beach face can be hundreds of metres wide at low tide. Other important features of a beach are in the near off-shore area, and include a trough and a longshore bar. As shown in Figure 17.17, the shape of a beach changes depending on the size of the waves coming in. During rough seasons the beach becomes depleted, and some of that sand is stored offshore in a larger than normal longshore bar.
Exercise: Identify the backshore, foreshore, and surf zone in Figure 5-3.
Enlarge
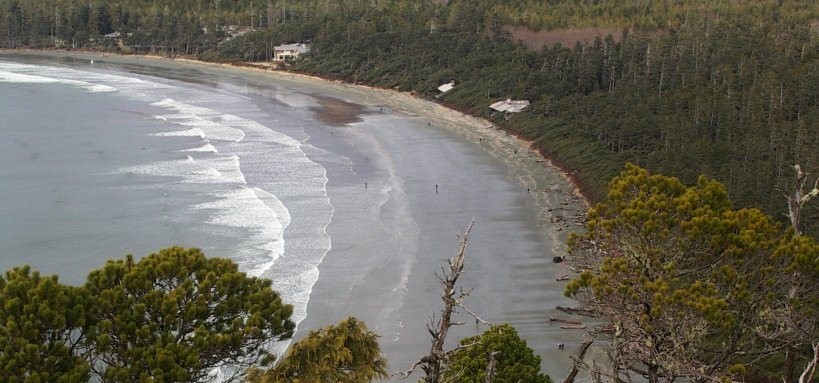
© Steven Earle. Used with permission.
Longshore drift causes the formation of a range of different coastal depositional features, including spits, bay-mouth bars, tombolos, and barrier islands. Please read about these in the textbook.
Completing Exercise 17.3 will help you to understand the processes that cause the formation of coastal depositional features.
Marine life is particularly abundant along tropical coasts, and in areas with relatively shallow, warm, and clear water (not clouded by river sediment, for example), organisms such as corals, sponges, urchins, coralline algae, and many others build reefs and produce an abundant calcareous sediment that forms white-sand beaches. Numerous other organisms are important on tropical shores, includes many types of green algae (Figure 6.9) and mangroves (Figure 5-4).
Enlarge
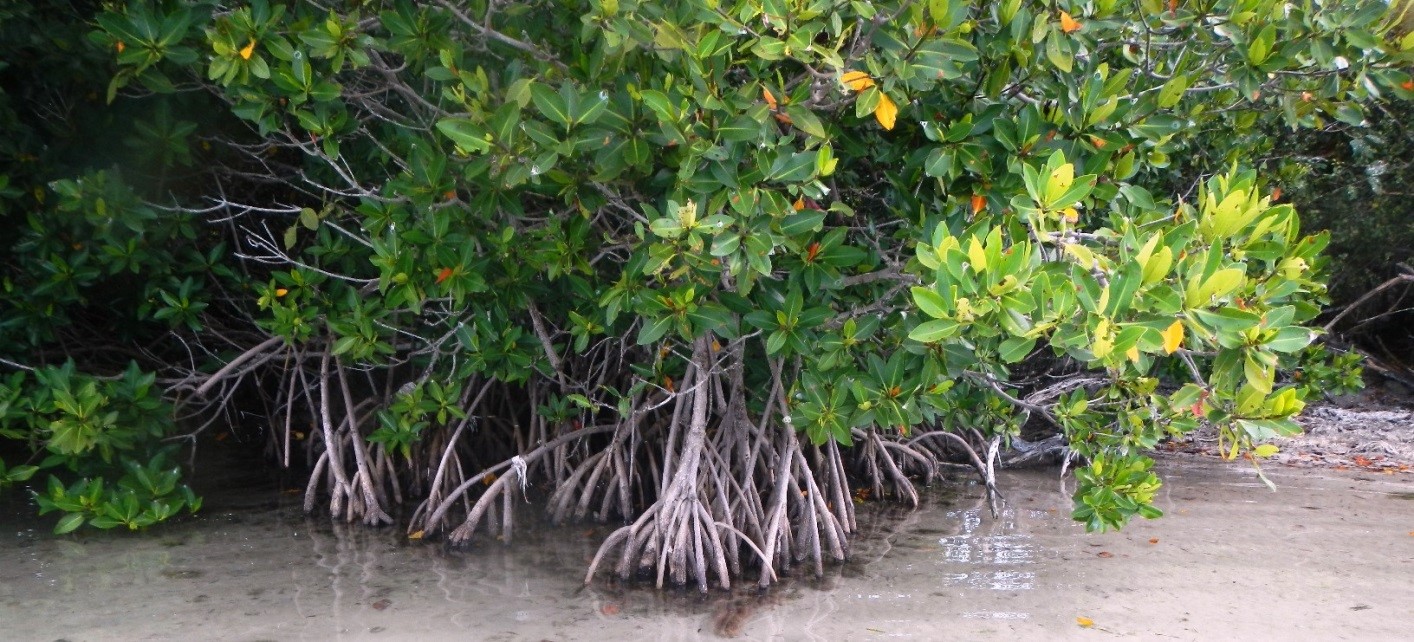
© Steven Earle. Used with permission.
Section 17.4 includes a discussion about the impacts of sea-level change. In unglaciated parts of the world, sea level rose by about 125 m during the last deglaciation—from 20,000 years ago to about 6,000 years ago. In areas that were strongly glaciated, like most of Canada, the amount of post-glacial sea-level rise has varied significantly because in these areas, the crust was depressed to varying degrees by glacial ice. In some areas, a post-glacial isostatic rebound equalled or exceeded the ice-melt (eustatic) rise, so an actual sea-level rise did not occur; instead, there was a relative sea-level drop. To make matters even more complicated, ice-melt (eustatic) sea-level rise is typically significantly faster than the isostatic crustal adjustments. For that reason, there are many locations around coastal BC where sea levels 12,000 years ago were significantly higher than they are now because the sea-level rose relatively quickly (over a few thousand years), but have “dropped” again because crustal rebound eventually caught up.
Exercise 17.4 is intended to help you to understand the implications of post-glacial ice-melt (eustatic sea level rise) and isostatic crustal rebound.
All over the world, people and governments have tried to modify shoreline processes to suit their own purposes, often with little regard for other people’s needs, and virtually no regard for the effects on ecosystems. Section 17.5 describes some of these modifications and their implications.
To enhance your understanding of the effects of shoreline modifications, complete Exercise 17.5.
5-2 Climate Change
The mechanisms of climate change are summarized in Section 19.1. The wide range of climate forcing processes include subtle changes in the Earth’s tilt and orbit, variations in the output of the Sun, changes in the locations of continents and ocean currents, and changes in the composition of our atmosphere. However, before we look at these processes, it’s important to understand the many different climate feedback mechanisms. One that is relatively easy to understand is the effect of melting snow and ice. Snow- and ice-covered surfaces are bright compared to bare ground, forests, or open water (see Figure 19.7), so when snow or ice melts, these exposed surfaces are inevitably darker and thus absorb more solar radiation. This is a positive feedback loop because climate warming leads to the loss of snow and ice, and the loss of snow and ice contributes to more warming. Figure 5-5 is an example of change in snow and ice: between 1981 and 2013, the areal extent of late-summer sea ice in the Arctic declined by around 2.5 million square kilometres. As described in the textbook, many different climate feedback mechanisms play a critical role in climate change.
Enlarge
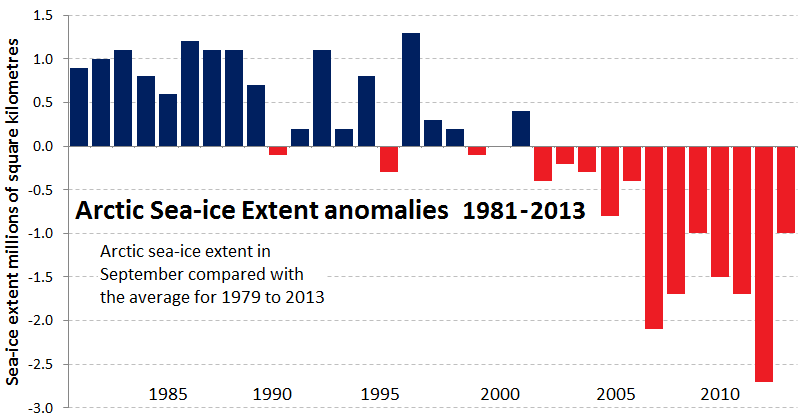
© Steven Earle. Data source: National Snow & Ice Data Center
The main forcing mechanism in this present era of human-caused climate change has been an increase in the concentration of greenhouse gases (GHG) in the atmosphere. The nature of GHGs, and the mechanism by which they control climate, are explained in Section 19.1. In brief, GHGs are gases with three or more atoms (e.g., CO2 and CH4) that vibrate at frequencies that match the frequencies of the infrared radiation emitted by the surfaces of the Earth that have been warmed by the Sun. When this infrared radiation strikes a GHG molecule, the molecule vibrates more vigorously than it does normally, which heats the molecule and warms the atmosphere. The higher the concentration of GHGs is in the atmosphere, the more infrared radiation is retained in the atmosphere. Global atmospheric CO2 levels are shown in Figure 5-6. In pre-industrial times, the CO2level was around 280 ppm. In 2014 it exceeded 400 ppm for the first time in several million years, and is very unlikely to drop below that level during the lifetime of anyone reading this sentence.
Exercise: By referring to Figure 5-6, estimate the average CO2 level in the year you were born. By how many ppm had it increased by 2016?
Enlarge
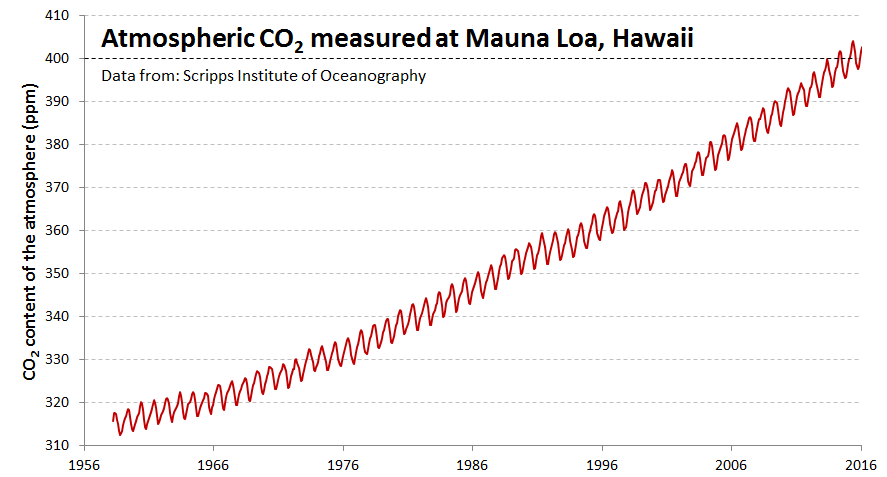
© Steven Earle: Data source: Scripps Institution of Oceanography
Section 19.1 also discusses the climate effects of Milankovitch Cycles. Read that part because it is relevant to the cycles of the Pleistocene glaciations, which we covered in Unit 4
Completing Exercise 19.1 will help you to understand some of the processes of natural climate change, and their implications for mass extinctions.
Figure 19.10 shows the record of global climate change from 1880 to the end of 2014. The number for 2015 (14.83˚ C, not shown) quite literally goes off the scale on that graph, and as of the middle of 2016, it appears that this year will exceed that scale as well. In other words, we are now seeing a full degree (C) of global average temperature change since 1880, with no signs of any slowdown.
The various mechanisms of anthropogenic climate change are discussed in Section 19.2, and you should read through that carefully because it is in everybody’s interest to understand why and how we are changing the climate.
The mechanisms of anthropogenic climate change are well understood, and it’s not difficult to calculate how our activities will drive future change. Completing Exercise 19.3 will help you discover how we can make the link between the radiative forcing changes that our activities have caused and both past and future global temperatures.
While most of us understand that we are changing the climate, few of us fully appreciate the consequences of that change, now and—even more so—in the future. Some of these consequences are summarized in Section 19.3, including (but not limited to) the following:
- Sea-level rise, which may seem slow at present, will accelerate steeply over the next several decades (Figure 19.13).
- The increased intensity of tropical and other storms (Figures 19.14 and 19.15), when combined with sea-level rise, will displace or harm hundreds of millions of people.
- Greater precipitation amounts in most areas will cause increased flooding and slope failures (Figures 19.16 and 19.17).
- The ranges of pests and diseases will increase (Figure 19.18).
- Heat waves will increase the risk of heat-related casualties (Figure 19.20).
Exercise 19.4 provides you with an opportunity to understand the relationship between El Niño and precipitation in British Columbia. The data provided only goes as far as 2005, but as you might remember, the most intense El Niño on record occurred in 2015/2016. While you’re doing this exercise, think about the effects of that event on the weather at the time.
More important than just understanding climate change is the need for all of us to do our part to reduce our personal climate-changing behaviours. Complete Exercise 19.5 and take some time to think about what you might do to reduce your own impact on the climate.
5-3 Geological History of Western Canada
Chapter 21 provides an overview of the geological history of western Canada, but to provide context, we need to look at the ancient geological history of Canada as a whole, as summarized in Section 21.1. Most of central, eastern, and northern Canada are underlain by the world’s largest area of ancient rocks (the Canadian Shield), and Canada is home to the oldest rocks in the world (the Nuvvuagittuq greenstone, from the eastern shore of Hudson Bay has been dated at 4.28 Ga, and the Acasta gneiss, from north of Yellowknife, has been dated at 4.05 Ga—see Figures 21.5 and 21.6). The Canadian Shield is made up of the ancient continent of Laurentia.
While it’s not necessary to understand all of the rocks of the Canadian Shield to learn about the geology of western Canada, it doesn’t hurt to know something about them. Completing Exercise 21.1 will help you to gain a very high-level view of the geology of Canada.
The western part of the exposed Canadian Shield is made up of a number of different provinces that formed at different times, and combined together due to a series of ancient continental collisions (Figure 21.5). All of the resulting mountain ranges have long since been eroded away, and these areas are now dominated by granitic and metamorphic rocks.
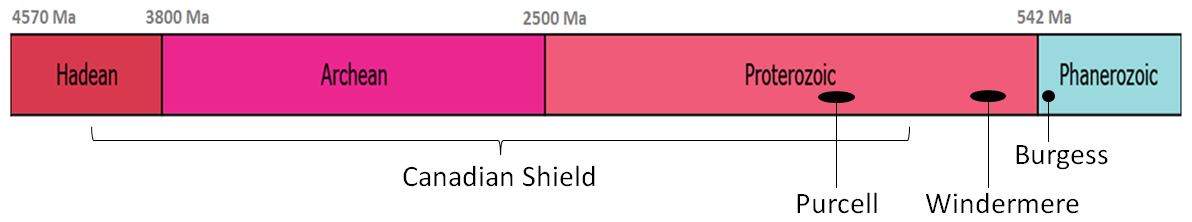
Some small areas of very old rocks in British Columbia—dated around 2 Ga—(Figure 21.7) may be part of the Canadian Shield, but by around 1400 Ma, new sediments were being deposited along this edge of Laurentia to form the Purcell Supergroup rocks that make up a large part of the southwestern Rocky Mountains and continue well into the United States. Considerably later (at around 700 Ma), the sediments of the Proterozoic-aged Windermere Group started to accumulate further to the north, and for the next few hundred million years—well into the Phanerozoic—sedimentation continued along this continental shelf, forming most of the rocks that were later pushed up to become the Rocky Mountains.
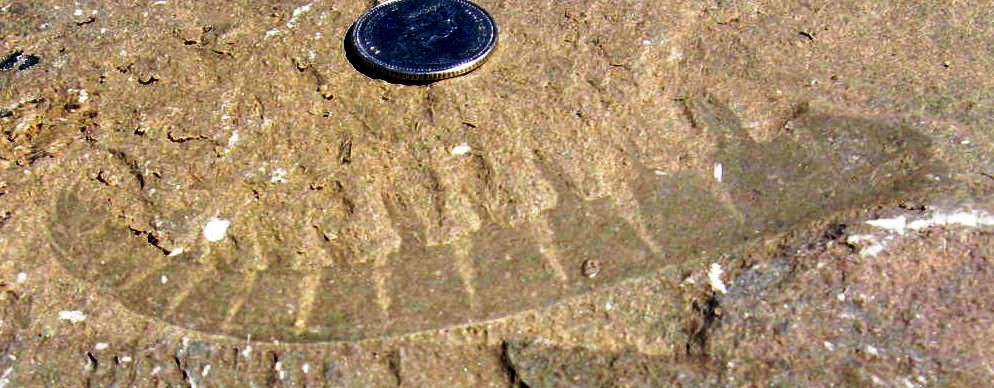
Included amongst the early Phanerozoic rocks of British Columbia is the Cambrian-aged Stephen Formation that includes the famous Burgess Shale Member, which is host to spectacular fossils that have changed and continue to change our perceptions of the evolution of early animals and plants (Figure 21.9 and Figure 5-7).
Enlarge
© Steven Earle. Used with permission.
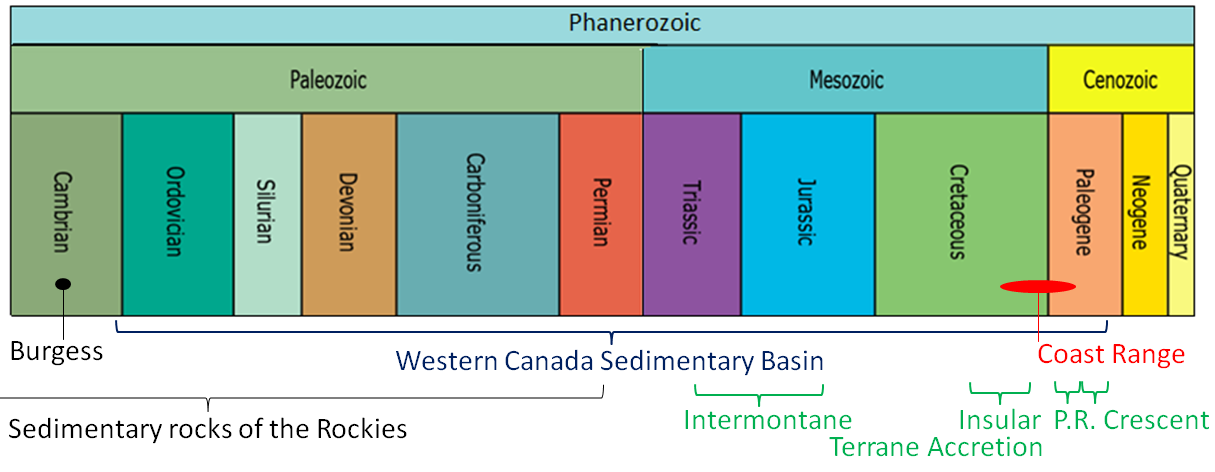
With respect to the geological time scale, Figure 5-8 illustrates some of the events that were significant to the early stages of the formation of western Canada.
Enlarge
© Steven Earle. Used with permission.
An accumulation of sediments along the Pacific coast of North America continued through most of the Paleozoic, during which time much of the west-central region of the continent also was under water. The Western Canada Sedimentary Basin persisted from the Ordovician through to the Paleogene (Figures 21.22 and 21.23 and Figure 5-9), accumulating both marine and terrestrial sediments ranging from deep-water mudstone to limestone, evaporite, and fluvial sandstone. Some of the important features of these rocks include thick and extensive potash deposits, various types of fossil fuels, and of course dinosaurs (Figures 21.24 and 21.25).
Enlarge
© Steven Earle. Used with permission.
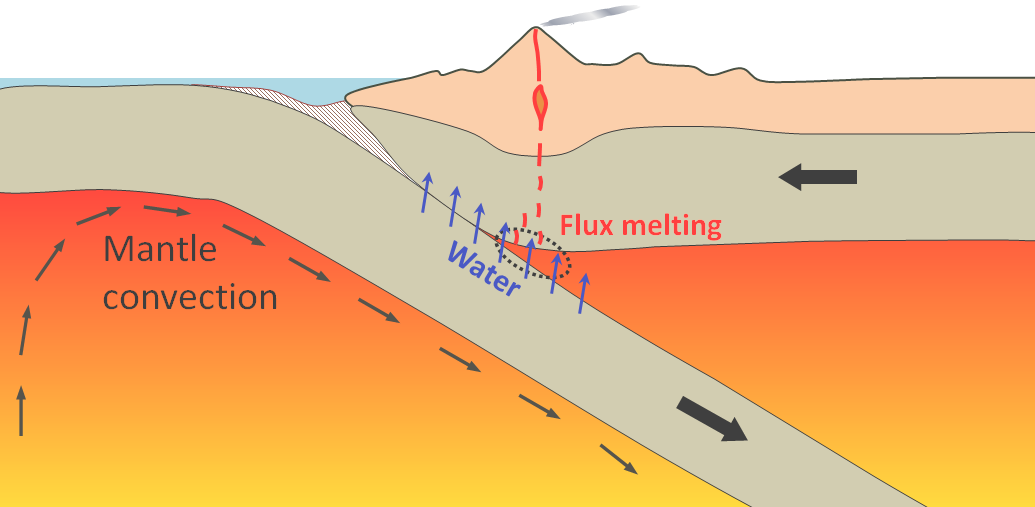
Meanwhile, after hundreds of millions of years, as a passive margin (meaning a no plate-margin tectonic processes), the Pacific (a.k.a. Panthalassic) coast of North America transformed into a subduction margin during the Carboniferous era (Figure 21.11). As oceanic crust started subducting beneath the North America plate, small continents and islands that originally had formed far out in the Pacific gradually moved towards the coast. These blocks of continental crust, now part of North America, are known as terranes.
The first of the exotic blocks to reach North America, known as the Intermontane Superterrane, arrived here during the Triassic and Jurassic eras (Figure 5-9). These exotic blocks are composed of a number of smaller terranes and now underlie a significant part of central British Columbia, the Yukon, and Alaska (Figures 2.13 and 2.14). These terranes, which originally formed in the Pacific as groups of islands like those of Japan or Indonesia, are dominated by Paleozoic and Mesozoic volcanic and sedimentary rocks. As the Intermontane terranes converged with the western edge of North America, they slowly pushed the existing Proterozoic and Paleozoic sedimentary rocks to the east—by tens to hundreds of kilometres—creating the Rocky Mountains (Figures 21.15 to 21.19).
The second set of exotic terranes (the Insular Superterrane) arrived on the coast of North America during the Cretaceous. These rocks now make up Vancouver Island, Haida Gwaii, and much of the Alaska Panhandle, and their convergence helped to push the Rocky Mountain sedimentary rocks even further east, creating some unusual situations where old marine rocks originally deposited offshore now lie on top of younger rocks originally deposited within the Western Canada Sedimentary Basin, as illustrated in Figures 21.18 and 21.19.
Completing Exercise 21.3 (in Section 21.3) will help you gain an understanding of the composition and age of the Wrangellia Terrane rocks (part of the Insular Superterrane) of Vancouver Island.
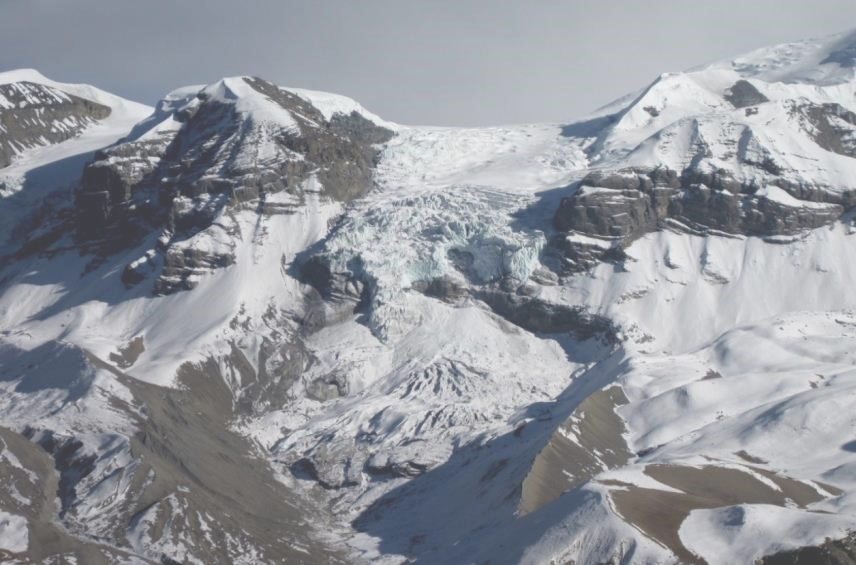
The subduction associated with the accretion of the Insular Superterrane produced a massive amount of volcanism along this part of the Pacific coast, and the associated magma bodies (granitic stocks and batholiths) cooled within the crust to form one of the most extensive belts of intrusive igneous rock on Earth. The Coast Plutonic Complex (Figures 21.20 and 21.21) extends north from Vancouver well into the Alaska Panhandle, and is the backbone of the Coast Range, which includes the tallest mountains in British Columbia, the Yukon, Alaska, Canada, and all of North America (Figure 5-10).
Enlarge
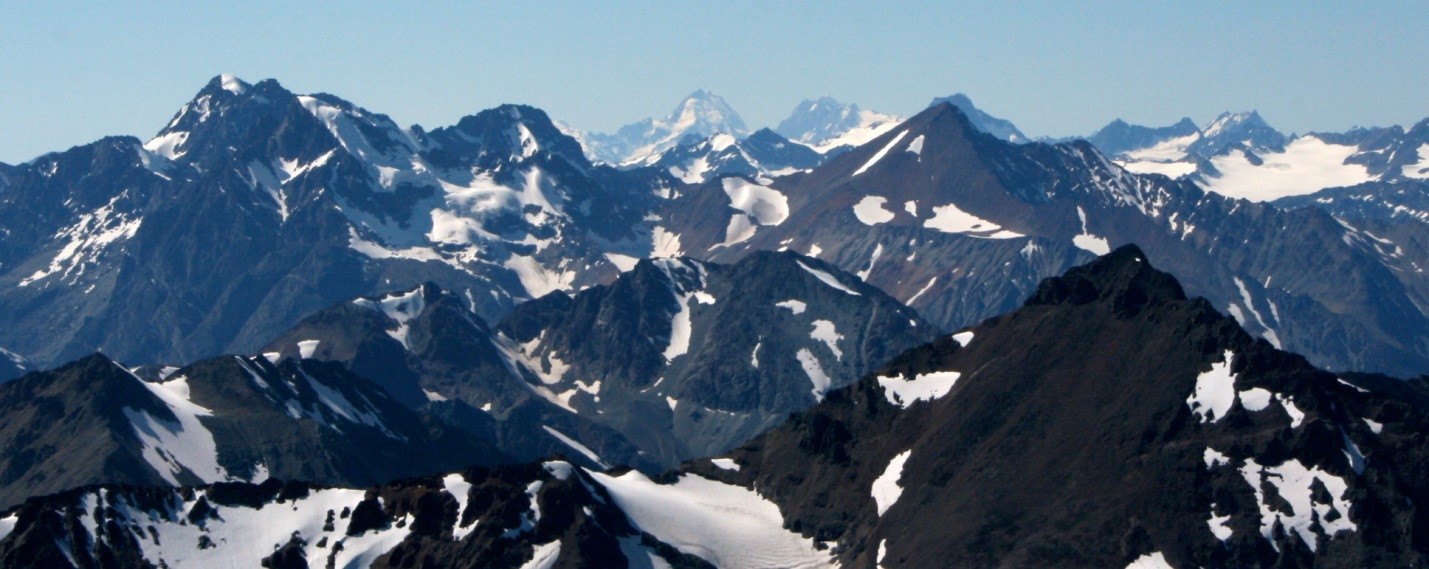
Teague, K. (2007). Mount Waddington [Digital image]. Wikimedia Commons. Retrieved from: https://commons.wikimedia.org/wiki/File:Mount_Waddington.jpg
During the Mesozoic, sediments continued to accumulate in the Western Canada Sedimentary Basin, while small terranes were being accreted to the west coast (Figures 21.22 and 21.23).
Exercise 21.4 is intended to help you understand the type of setting in which some of the Cretaceous sediments of the Western Canada Sedimentary Basin were deposited, including those rich in dinosaur fossils.
As described in Section 21.5, two additional terranes were accreted to the west coast during the Cenozoic. The Pacific Rim and Crescent Terranes make up the western part of Vancouver Island, and their accretion is responsible for the folding and uplift of Cretaceous Nanaimo Group rocks (Figures 21.26 to 21.28). As shown in Figure 5-11, the successive addition of exotic terranes has caused the shifting of the location of subduction along the continental margin. After the accretion of the Pacific Rim Terrane subduction shifted about 40 km west, and after the accretion of the Crescent Terrane it shifted about 75 km further west, to where it lies today. Of course, this also implies that in the Paleozoic and Mesozoic, when the Intermontane and Insular Superterranes arrived on our coast, the subduction zone was well to the east of the current coastline, somewhere in what is now central British Columbia, and that this zone shifted west later at least once during the Mesozoic.
Enlarge
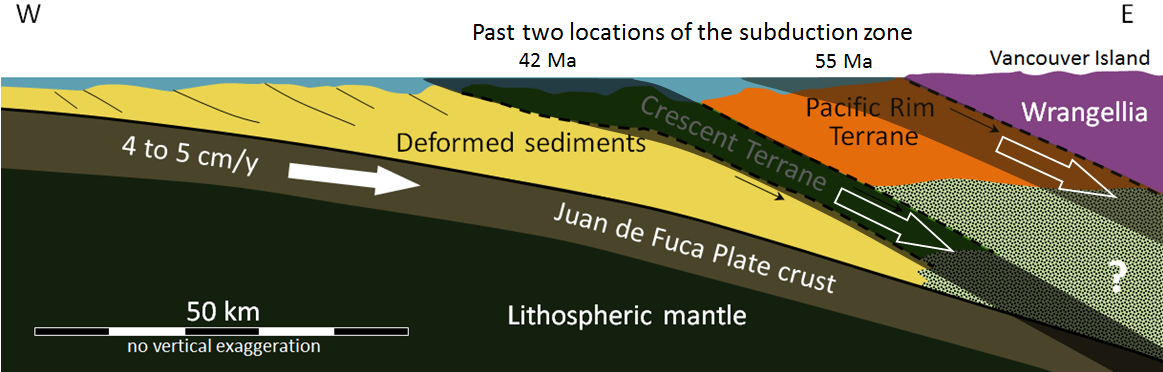
© Steven Earle. Used with permission.
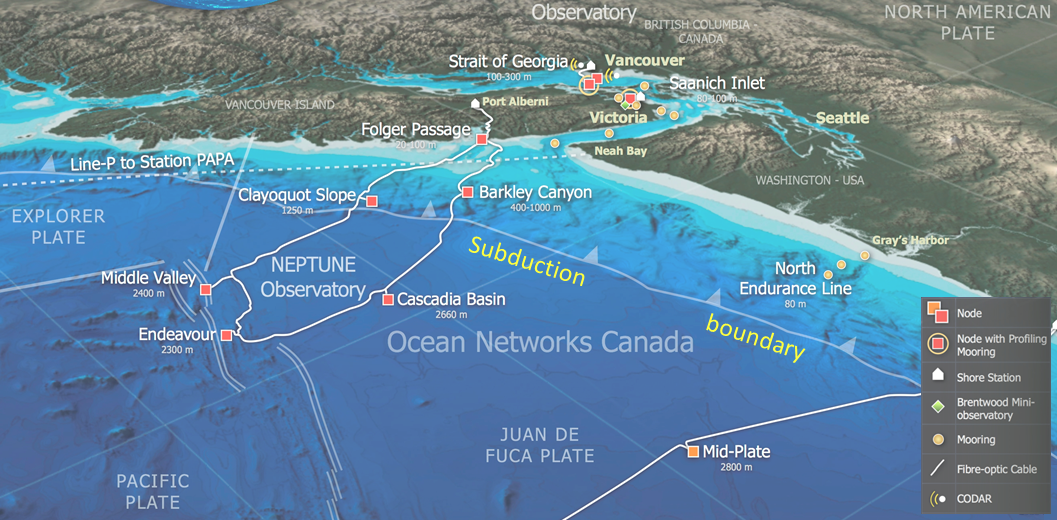
The modern-day plate tectonic situation along the western coast of North America is shown in Figure 21.29. The Juan de Fuca and Pacific Plates are forming along the spreading ridge. The Pacific Plate is moving to the northwest, sliding beside the North America Plate along the Queen Charlotte Fault (a transform fault) and subducting beneath the North America Plate south of Alaska. The Juan de Fuca Plate (and the Gorda and Explorer sub-plates) are subducting beneath the North America Plate beneath British Columbia, Washington, Oregon, and northernmost California. Composite volcanoes have formed inland from both of these subduction zones.
Exercise: Watch an animated overview of the geological history of Canada below.
Please answer the review questions at the end of Chapter 21.
This completes the notes for Unit 5.
If you haven’t already done so, now is the time to start working on Assignment 5 (go to “Assignments” on your course Home Page). You should find most of what you need to complete the assignment within these course notes and Chapters 17, 19, and 21 of your textbook, but you also might need to refer to other sources of information.